
Banking giant Citi says the billions of dollars pulled out of spot Bitcoin exchange-traded funds (ETFs) are the main culprit driving the sell-off as BTC plummets to a price last seen in February of this year.
The News
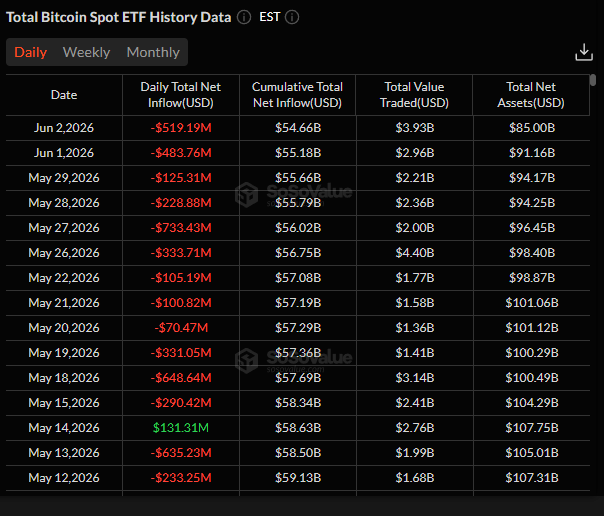
Citi analyst Alex Saunders says the $3.8 billion withdrawn from spot Bitcoin ETFs between May 15th and June 2nd is the primary catalyst for the sell-off, rather than Michael Saylor’s Strategy sale of 32 Bitcoin in late May.
Saunders cites data from the crypto market research firm SoSovalue showing that Bitcoin ETFs have recorded 11 consecutive days of trading outflows, the longest streak since launching in 2024. Data from SoSovalue shows that spot BTC ETF net outflows hit $733.45 million on May 27th, $648.64 million on May 18th and $519.19 million on June 4th.
Saunders also notes that ETF flows account for 45% of weekly fluctuations in Bitcoin returns, making the metric one of the most crucial factors in BTC price action. The analyst adds that US equity strength is adding more pressure on BTC, while the deteriorating outlook for the crypto market structure bill, the Clarity Act, is contributing to dampened investor interest.
In March, Citi dropped its 12-month forecast for Bitcoin from $143,000 to $112,000, citing slow legislative progress of the Clarity Act, which is expected to boost demand for BTC ETFs and drive broader institutional adoption.
What It Means for Investors
News like billionaire Mark Cuban selling most of his Bitcoin holdings, Strategy unloading a fraction of its ownership and billions of dollars in BTC sold on the open market have historically been bottom signals for the top crypto asset by market cap.
During Bitcoin’s “Black Thursday” in March 2020, BTC fell 50% in a single day after $1.2 billion in long positions were wiped out amid global liquidity concerns due to the Covid-19 pandemic. In 2022, $3.5 billion in leveraged positions were annihilated following the collapse of the FTX crypto exchange.
Data from Coinglass shows that $1.58 billion in leveraged positions were liquidated on June 2nd, making it the largest single-day liquidation event so far this year. Meanwhile, CoinMarketCap’s Crypto Fear and Greed Index shows that extreme fear is now driving the market.
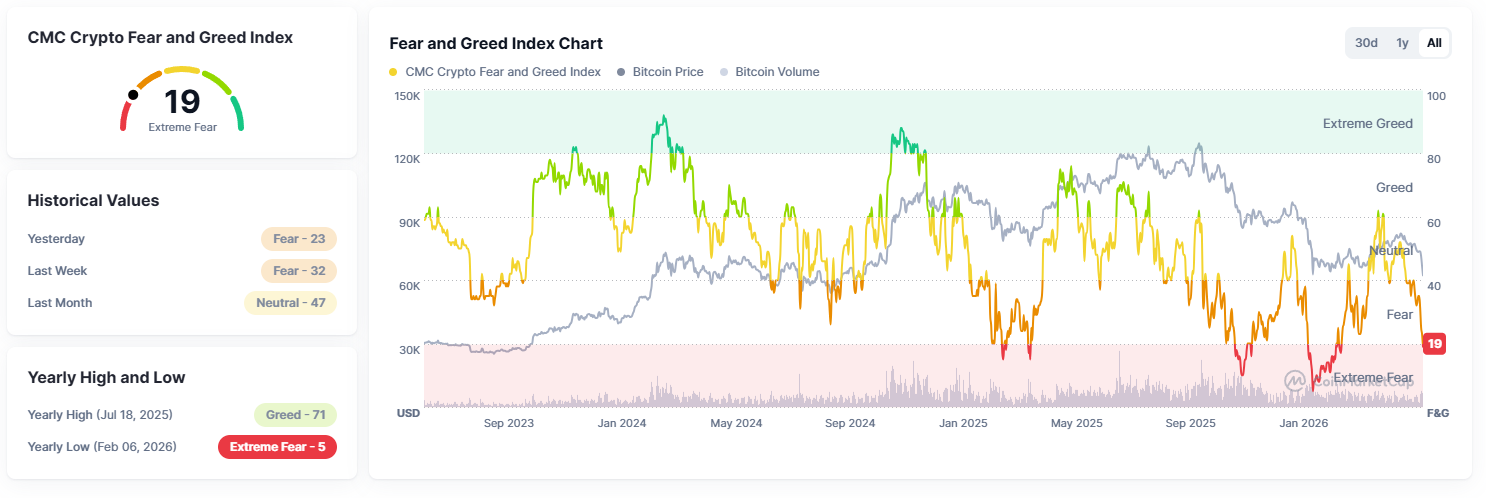
Investor sentiment and BTC ETF net outflows appear to point to capitulation, which typically precedes a major market bottom.
Looking at Bitcoin’s weekly chart, BTC is trading at a critical support level around $62,000 and appears to be respecting the 200-week moving average as support. Its relative strength index (RSI), a momentum indicator, looks to be on the verge of flashing a bullish divergence, suggesting that selling momentum is weakening despite falling prices.
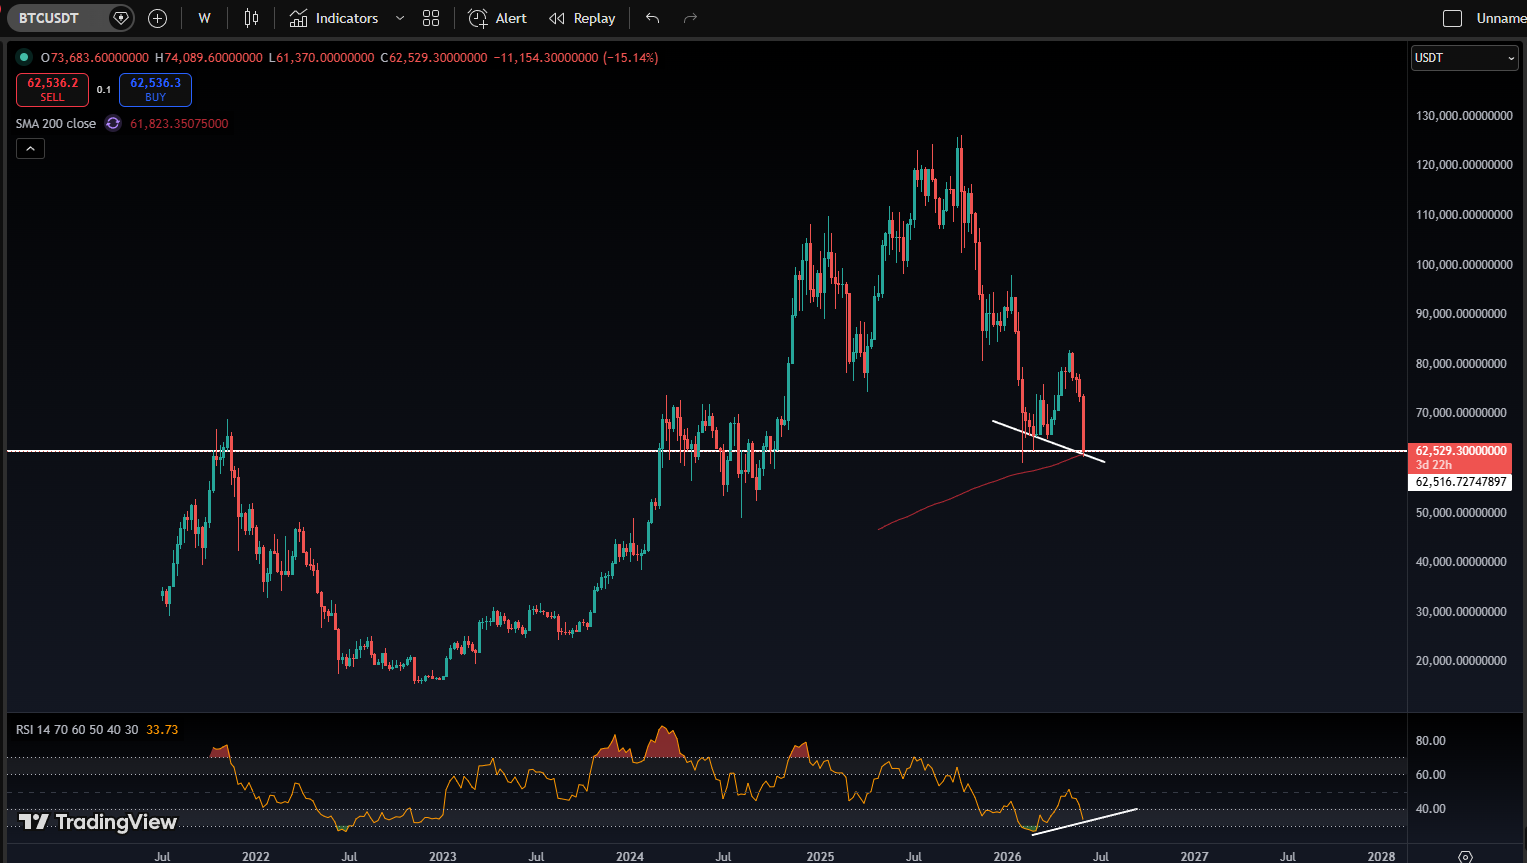
While Bitcoin is flashing historical and technical bottom signals, they are not a guarantee that the bear market low is in for BTC. In the markets, anything can happen, but as Warren Buffett famously said, “Be fearful when others are greedy, and greedy when others are fearful.”
Disclaimer: Opinions expressed at CapitalAI Daily are not investment advice. Investors should do their own due diligence before making any decisions involving securities, cryptocurrencies, or digital assets. Your transfers and trades are at your own risk, and any losses you may incur are your responsibility. CapitalAI Daily does not recommend the buying or selling of any assets, nor is CapitalAI Daily an investment advisor. See our Editorial Standards and Terms of Use.