
The US and Iran have just reached an agreement to end hostilities and reopen the Strait of Hormuz, a critical passageway through which 20% of the global oil supply passes.
On Truth Social, US President Donald Trump says, “Oil will flow on both ends again for the region, and the world!” Oil prices are tumbling, with US crude oil (WTI) down over 5% on the day, trading at $80.85 per barrel. It seems that the days of higher energy prices are over, and markets are poised for fresh rallies as the final overhang disappears.
We looked at multiple data sources to separate the true narrative from the noise and found two supercycle trades emerging from the geopolitical conflict. The first is obvious, but the second one, not so much.
The First “Supercycle” Trade: Energy
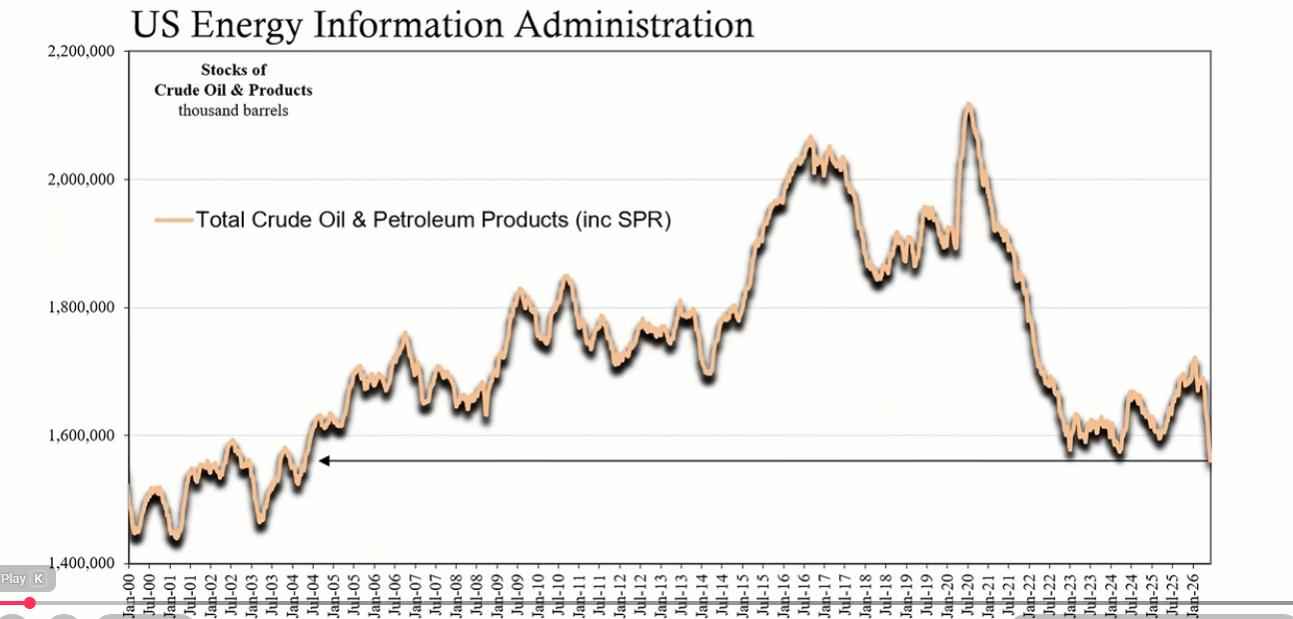
While it’s easy for an average investor to assume that lower oil prices are in sight, the data is showing otherwise. In a video update, Atlas Financial chief strategist Jeff Snider says US oil inventories have been drained to a level not seen in over 20 years.
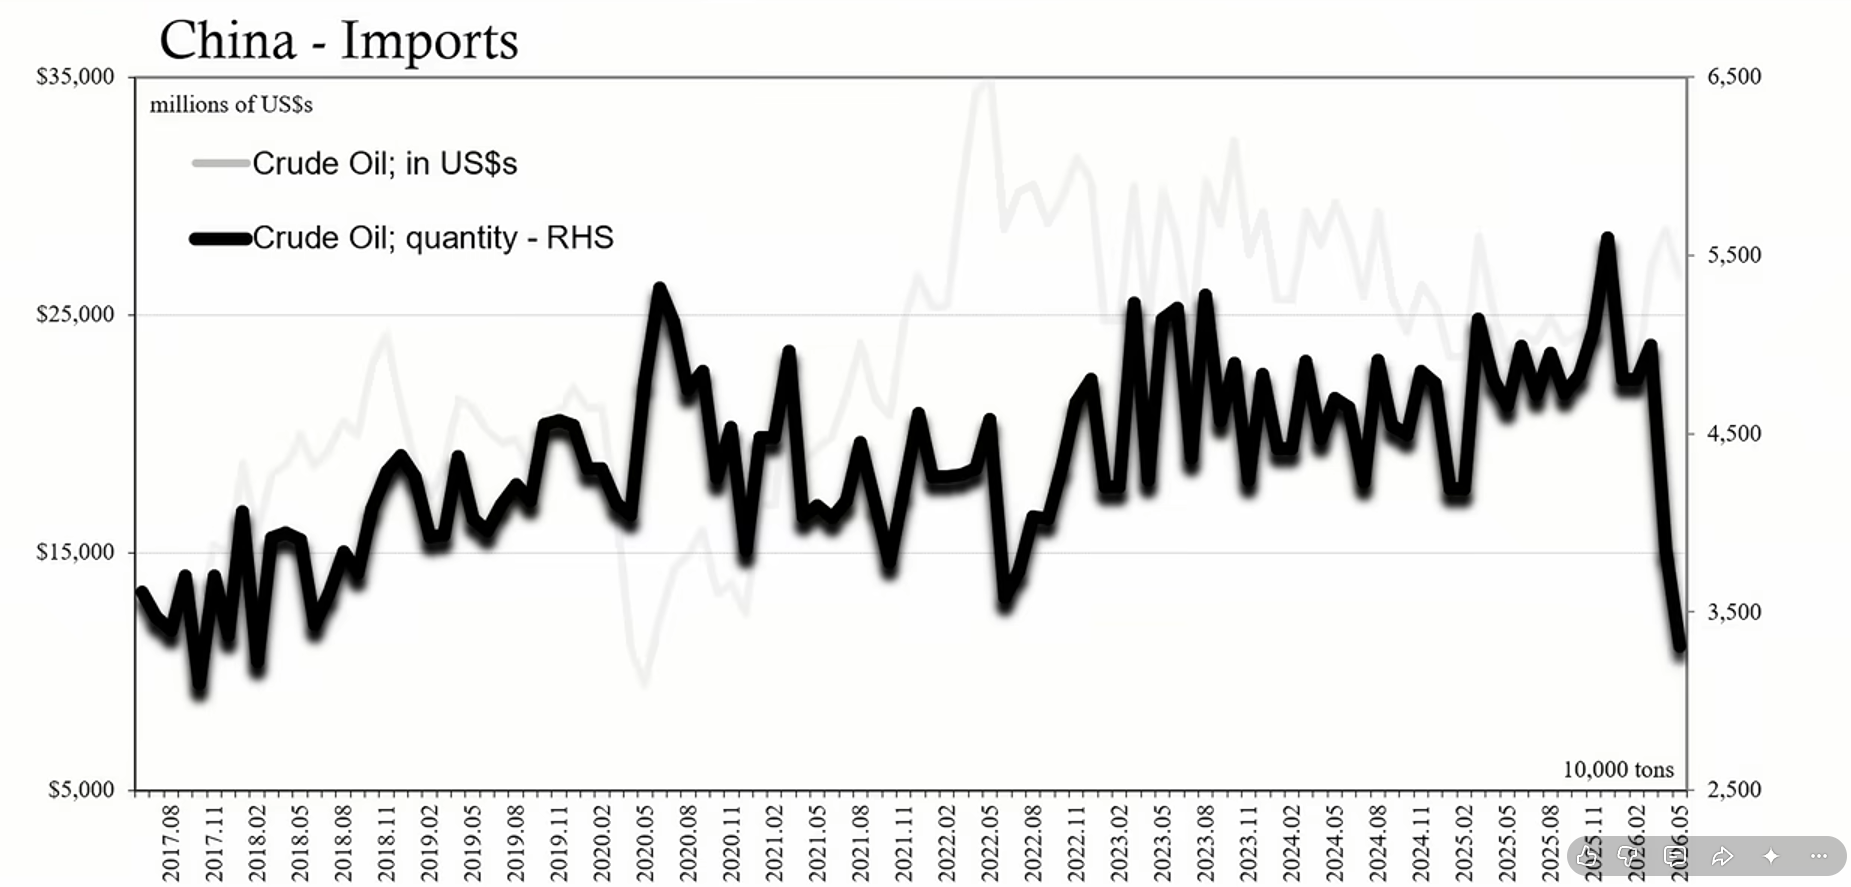
It’s the same story for China, as Snider shares data showing oil inventories plummeting to their lowest level since 2018.
While Snider expects short-term selling in oil, he notes that the energy supply shock is now at the next stage of the crisis.
And the crisis appears to be on a collision course with historical cycles. Last month, former global head of commodities research at Goldman Sachs, Jeffrey Currie, said that energy and tech have taken turns in leading the market since the post-war era.
“Tech was a leader in the 90s, all the way up to 2002. Then we transitioned into energy from 2002 to 2014. From 2014 to now has been technology.”
Currie now believes that energy has taken the reins, believing it is at the bottom in the first inning of what could be a 12-year supercycle.
A massive shift in energy ETF flows suggests that Currie may be early in sniffing out a multi-year trend.
Close Look at Energy ETF Flows
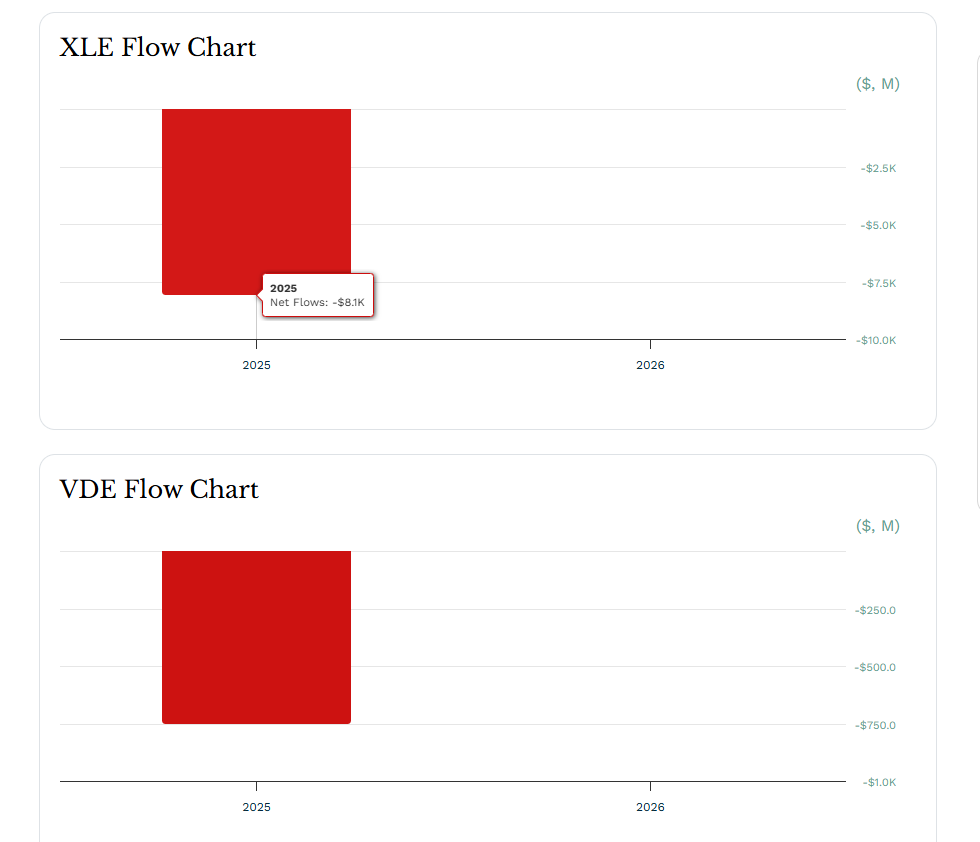
Energy exchange-traded funds (ETFs) have come to life this year, and two of the biggest energy ETFs, the State Street Energy Select Sector SPDR (XLE) and the Vanguard Energy Index Fund (VDE), are witnessing massive net flow reversals. Meanwhile, ETF flows in other sectors are heading in the opposite direction.
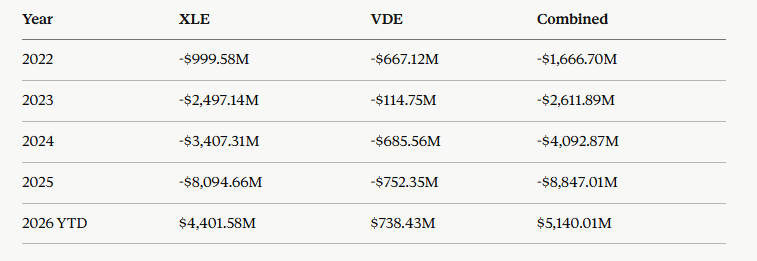
In 2025, XLE recorded -$8.094 billion while VDE printed -$752.35 million in net flows.
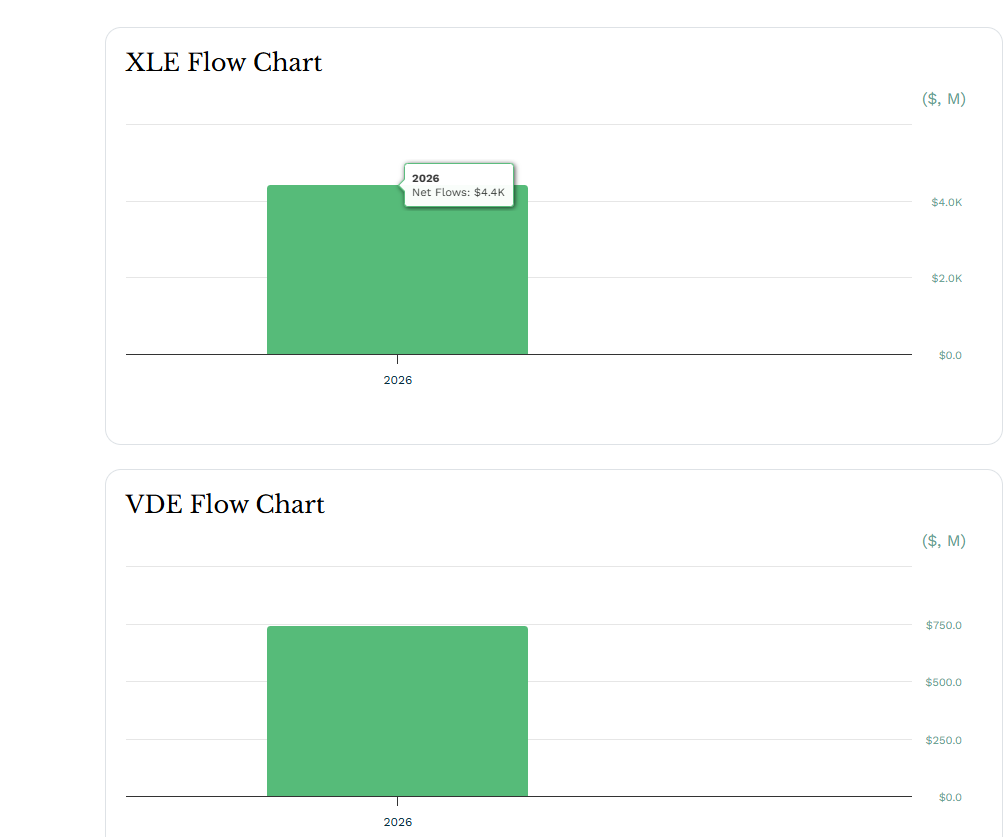
The trend shifted positive this year as XLE is already seeing $4.401 billion in net flows and VDE is witnessing $738.43 million year-to-date. That’s a massive reversal to the tune of $13.97 billion, and we’re just halfway through the year.
In comparison, other large ETFs are recording huge reversals to the downside or slightly positive growth. The table below shows the stark difference in flows between energy ETFs and other sectors.
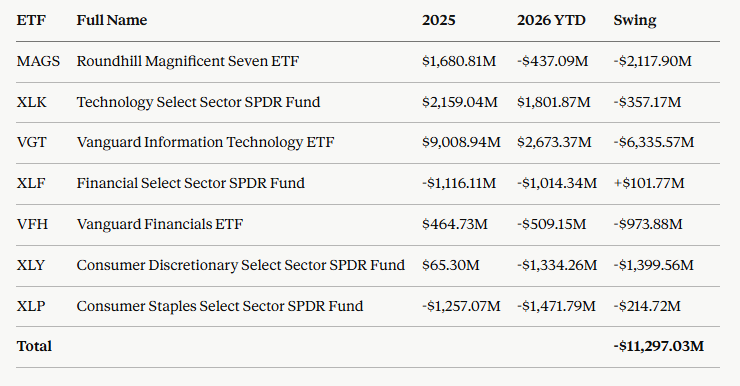
Compared to all of 2025, tech, consumer, and financial ETFs have seen their net flows deteriorate by $11.3 billion, while energy ETFs have swung by a staggering $13.97 billion in the opposite direction, from heavy outflows last year to meaningful inflows in 2026.
But extending the time frame for energy ETFs shows the magnitude of this year’s reversal in flows. Combined, XLE and VDE bled $1.67 billion in 2022. By 2025, that figure had ballooned to $8.85 billion, a more than fivefold increase in outflows over three years before turning positive in the first half of this year.
The data suggests that a colossal shift is happening under the hood. Is it just a mad scramble to get energy exposure following the conflict in the Middle East, or is Currie right that the early stages of a supercycle are underway?
Institutional Positioning in Chevron (CVX) and Exxon Mobil (XOM)
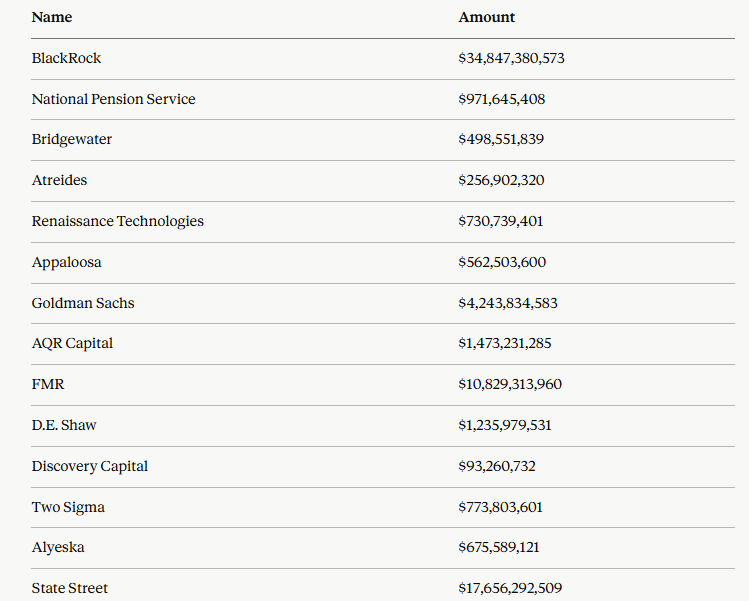
We have scoured 100 13F filings with the Securities and Exchange Commission (SEC) to see whether institutions are pouring money into the top two energy names: Chevron and Exxon Mobil. In the sample, only six institutions hold meaningful positions in CVX and XOM.
In Q1 of 2026, BlackRock added to its stake in Exxon Mobil, gobbling up $1.95 billion in XOM shares, boosting its stake to $54.756 billion. In the same quarter, the firm also bought 3,429,634 CVX shares, increasing its holdings to 144,720,031 CVX shares worth $29.942 billion.
The National Pension Service of South Korea is also diving into the energy trade, owning $1.611 billion in XOM shares and $926 million in CVX shares as of the quarter ending March 31st.
Banking giant JPMorgan Chase added 15,223,344 XOM shares in Q1, bringing its total Exxon Mobil exposure to $14.678 billion. Fidelity Investments (FMR LLC) holds $23.754 billion in XOM, while Fisher Asset Management also owns $5.477 billion in XOM. Both firms meaningfully added to their XOM stakes in Q1.
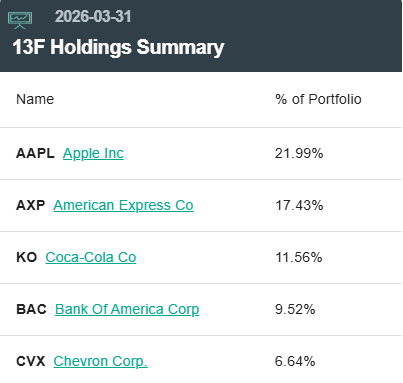
Warren Buffett’s Berkshire Hathaway sold 35% of its CVX holdings in Q1, but the firm still holds $17.46 billion in Chevron, accounting for 6.6% of its portfolio.
Even though only a fraction of the institutional investor sample has meaningful positions in Chevron and Exxon Mobil, both CVX and XOM have hit all-time highs in March and are now consolidating gains.
With a peace deal on the horizon, what could drive oil prices higher and trigger institutional buying?
The Catalyst for the Energy Trade
A closer look at US oil inventories shows a dire situation. Rapidan Energy Group president Bob McNally says the US is at an 11-year seasonal low for gasoline, a 29-year seasonal low for distillates, and a 43-year low on the Strategic Petroleum Reserve (SPR).
In April, Morgan Stanley head of commodities research Martijn Rats said that while tensions in the Middle East could ease, the extended oil supply disruption is a wake-up call for many countries, specifically in Southeast Asia, to build reserves.
McNally echoes that view, saying he sees soaring demand for crude oil as China looks to build bigger reserves, along with many countries in Asia and Europe. He notes that the pent-up demand will likely exceed oil production and drive prices higher.
It appears that oil will never be the same, and the massive shift in ETF flows and limited institutional exposure suggests that a scramble for the commodity is on the horizon.
The Second “Supercycle” Trade: Memory
While energy is the obvious trade emerging from the regional conflict, many don’t see the connection between memory and the Middle East.
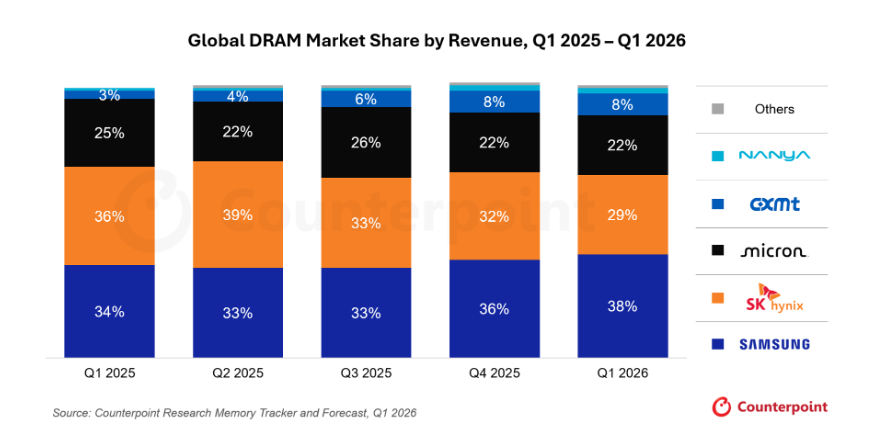
The memory market is dominated by a handful of key players: SK Hynix, Samsung and Micron (MU). In Q1 2026, Samsung accounted for 38% of the global dynamic random access memory (DRAM) market share by revenue, followed by SK Hynix at 29% and Micron at 22%.
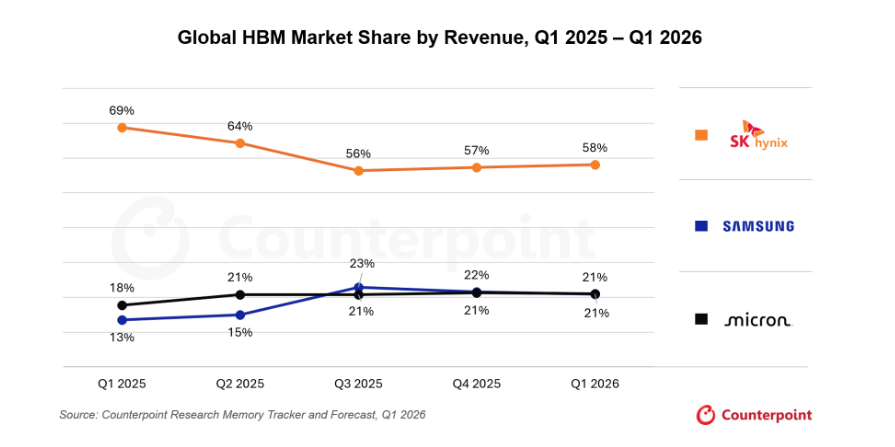
Meanwhile, SK Hynix dominates the global market for high-bandwidth memory (HBM), accounting for 58% of revenue in Q1, with Samsung and Micron tied at 21%.
All three companies account for over 90% of global memory chip production. The chips are largely manufactured at energy-intensive fabrication plants in South Korea, Taiwan and China.
This is where the conflict involving Iran further squeezes a market already witnessing supply-chain constraints.
In April, Manufacturing Dive reported that missile and drone strikes disrupted production at Qatar’s Ras Laffan hub, effectively removing 20% of global liquefied natural gas (LNG) supply. According to the report, electricity costs for fabrication plants in South Korea and Taiwan skyrocketed, forcing a choice between chip production and residential heating.
Amid rising electricity costs and energy disruption, hyperscaler demand for DRAM and HBM shows no signs of letting up soon.
According to S&P Global, the four largest hyperscalers are expected to shell out $974 billion by 2028 to expand data center capacity, spurring multi-year demand for DRAM and HBM. Meanwhile, Morgan Stanley predicted that memory-hungry AI models would catalyze demand for memory from $220 billion in 2025 to about $890 billion in 2026, a near-quadrupling fueled entirely by AI infrastructure.
The demand for memory is reflected in massive ETF flows this year.
A Close Look at Memory ETF Flows
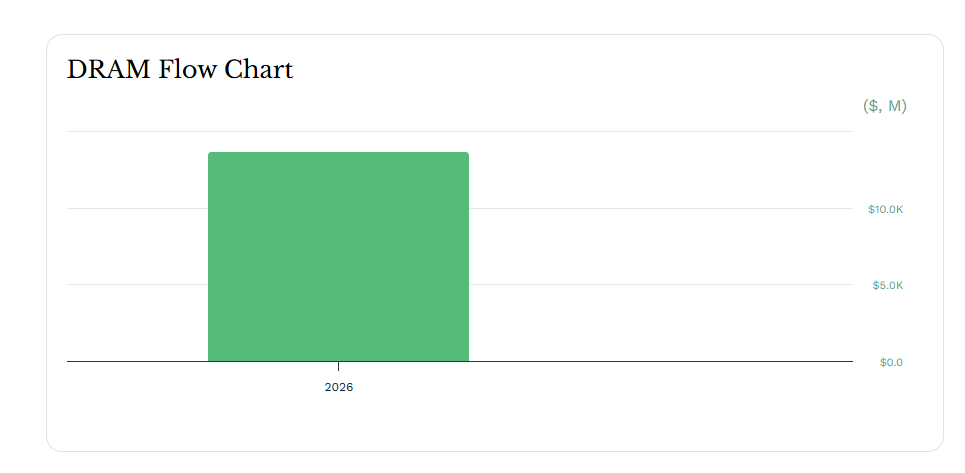
The Roundhill Memory ETF (DRAM) is designed for heavy exposure to memory giants, assigning a roughly 28% weight to Micron, 25% to SK Hynix and 21% to Samsung. The ETF was just launched in April, and the data shows staggering demand to the tune of $13.7 billion in net flows.
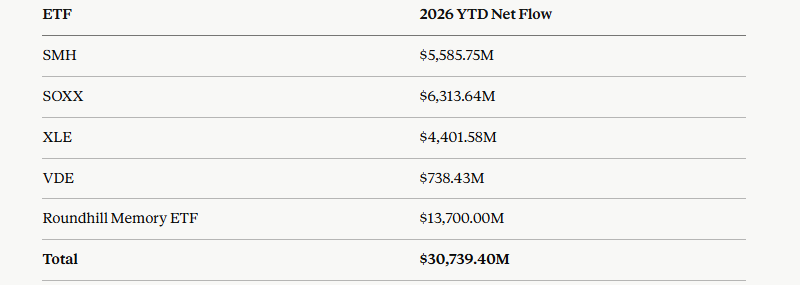
Two other big ETFs have meaningful weights in Micron: the VanEck Semiconductor ETF (SMH) and the iShares Semiconductor ETF (SOXX). Year to date, SOXX has witnessed $6.314 billion in net flows, while SMH has seen $5.585 billion in net flows.
Combined with the two energy sector ETFs, net flows this year for the two supercycle plays total $30.739 billion, all while major ETFs in other sectors bleed.
Institutional Positioning for Micron (MU)
Since SK Hynix and Samsung are listed on the Korean Composite Stock Price Index (KOSPI), we focused on Micron for institutional positioning.
Out of the 100 SEC 13F filings we scoured, we were surprised to learn that only 14 institutional investors have meaningful portfolio allocations to Micron as of Q1 this year.
Despite Micron’s HBM-driven earnings beat and the broader memory supercycle thesis being well-covered by financial analysts, actual institutional positioning remains concentrated in a small number of firms. The data also suggests that the smart money appears to be early to Micron, while the broader market has yet to catch up, leaving room for upside potential.
One Shock, Two Trades, One Blind Spot
Zoom out far enough, and the connection between the energy and memory trades is not a coincidence. The war in Iran closed the Strait of Hormuz, draining oil reserves across the world and serving as a wake-up call for many countries to boost oil inventories. Meanwhile, damage knocked out a fifth of the world’s LNG capacity at Ras Laffan, and that LNG supply is crucial for keeping the lights on at the fabrication plants in South Korea and Taiwan.
One shock, two supply shortages and two massive sectoral capital ETF flow shifts that on the surface look unrelated but stem from the same root cause. And yet, data on institutional positioning in the underlying stocks indicates the two trades are early rather than crowded.
Only time will tell whether supercycle calls in the energy and memory trades ultimately play out, but the blind spot offers an opportunity for investors to be early.
Disclaimer: Opinions expressed at CapitalAI Daily are not investment advice. Investors should do their own due diligence before making any decisions involving securities, cryptocurrencies, or digital assets. Your transfers and trades are at your own risk, and any losses you may incur are your responsibility. CapitalAI Daily does not recommend the buying or selling of any assets, nor is CapitalAI Daily an investment advisor. See our Editorial Standards and Terms of Use.