 Surges 20.36% in a Day – Here Are the Key Price Levels")
The popular document database platform MongoDB (MDB) has surged more than 20% in just one trading session, days after the company released its Q1 fiscal 2027 earnings report.
The News
On May 28th, MongoDB reported $687.6 million in revenue for the first quarter of fiscal 2027, shattering consensus estimates of $644 million.
Meanwhile, the firm posted adjusted earnings per share (EPS) of $1.32 to beat estimates of $1.19.
MongoDB president and CEO CJ Desai says the company has the right team in place to move with even greater velocity.
“We delivered better-than-expected first quarter results, as our go-to-market teams continue to execute well and capitalize on strong end-market demand for the MongoDB platform across enterprise use cases and emerging AI opportunities.”
As a document database, MongoDB has several AI use cases. The company allows developers to store, search and manage data for AI applications in one unified platform.
The Breakout and What It Means for Investors
MongoDB’s surge to $403 is a clear reversal from its downtrend that began earlier this year. In January, MDB peaked at around $444 and dropped to as low as $215 on April 10th, an over 51% decline in just four months, as investors turned bearish on software and tech.
Monday’s price action suggests that MDB is now in an uptrend after breaching resistance at around $337 and breaking out from an inverse head-and-shoulders pattern on the daily timeframe.
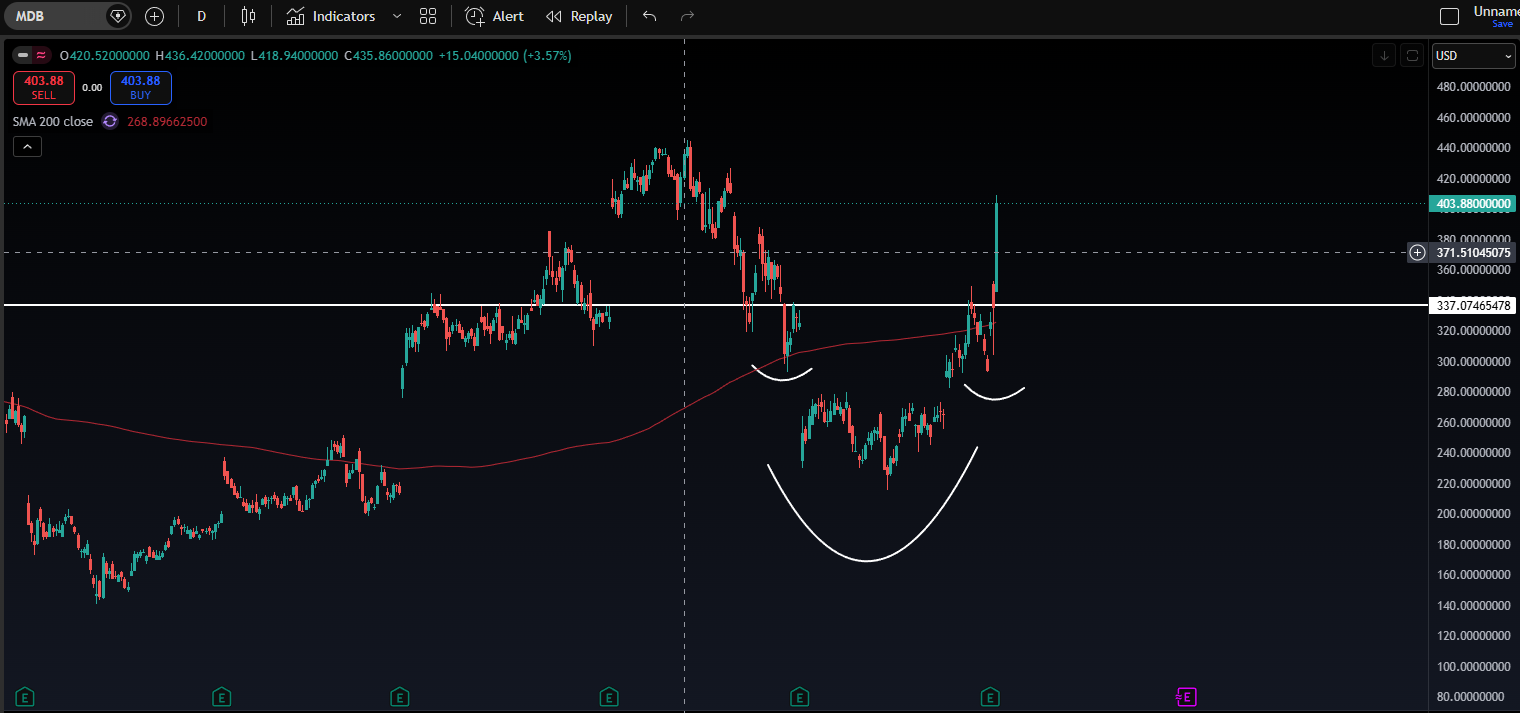
An inverse head-and-shoulders pattern is a classic technical analysis formation, indicating that buyers are prepared to buy a stock without waiting for it to return to its lows. In MDB’s case, buyers stepped in at around $295, and the momentum pushed the stock above the resistance, or neckline.

In technical analysis, traders use the size of the pattern to gauge the price target of the breakout. Applying that strategy, MongoDB’s price target appears to hover around $445, which is in line with a strong resistance level on the weekly timeframe.
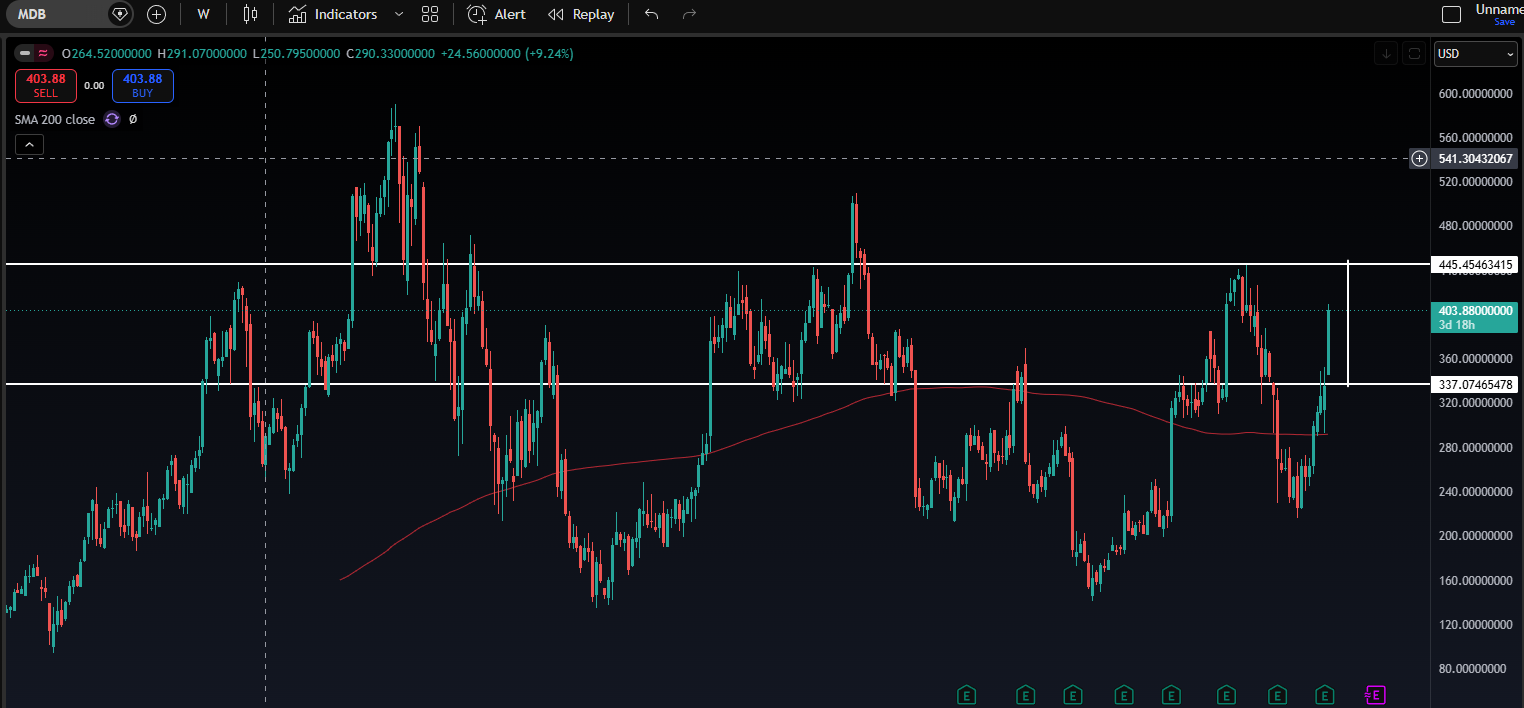
Anything can happen in the market, so traders use technical analysis to create structure in chaos. I’m closely watching the area around $337 as a potential entry with a measured move at $445. MDB’s 20% single-day rally is a sign of strong momentum, so it is within the realm of possibility for the stock to hit $445 without pulling back.
However, risk assets don’t move in a straight line, and they tend to return to the neckline or breakout point to retest it as support, allowing investors to accumulate on dips. Invalidation is a strong move below its 200-day moving average at around $324.
In any case, MongoDB’s technical structure suggests it could trade in a range between $337 and $445 in the coming weeks, unless it breaks above $445 or slides below $337.
Disclaimer: Opinions expressed at CapitalAI Daily are not investment advice. Investors should do their own due diligence before making any decisions involving securities, cryptocurrencies, or digital assets. Your transfers and trades are at your own risk, and any losses you may incur are your responsibility. CapitalAI Daily does not recommend the buying or selling of any assets, nor is CapitalAI Daily an investment advisor. See our Editorial Standards and Terms of Use.